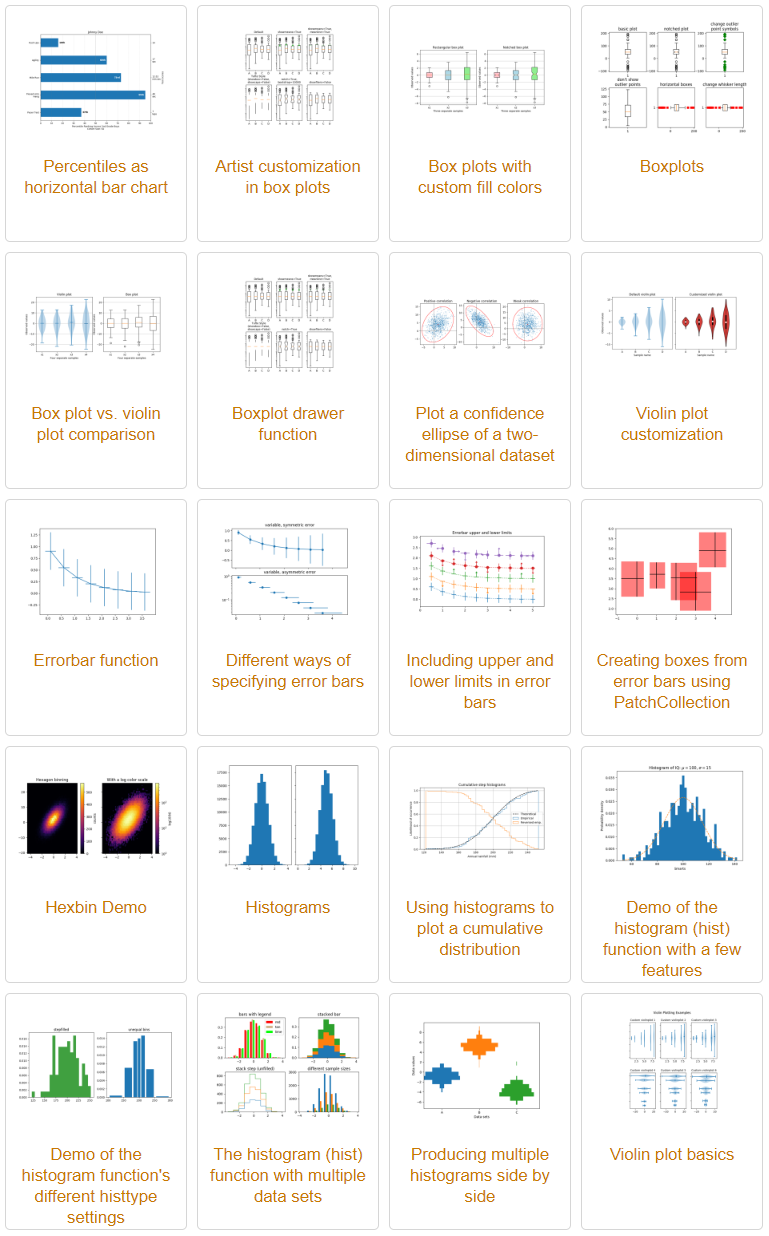
Matplotlib
https://matplotlib.org/gallery/index.html
Seaborn

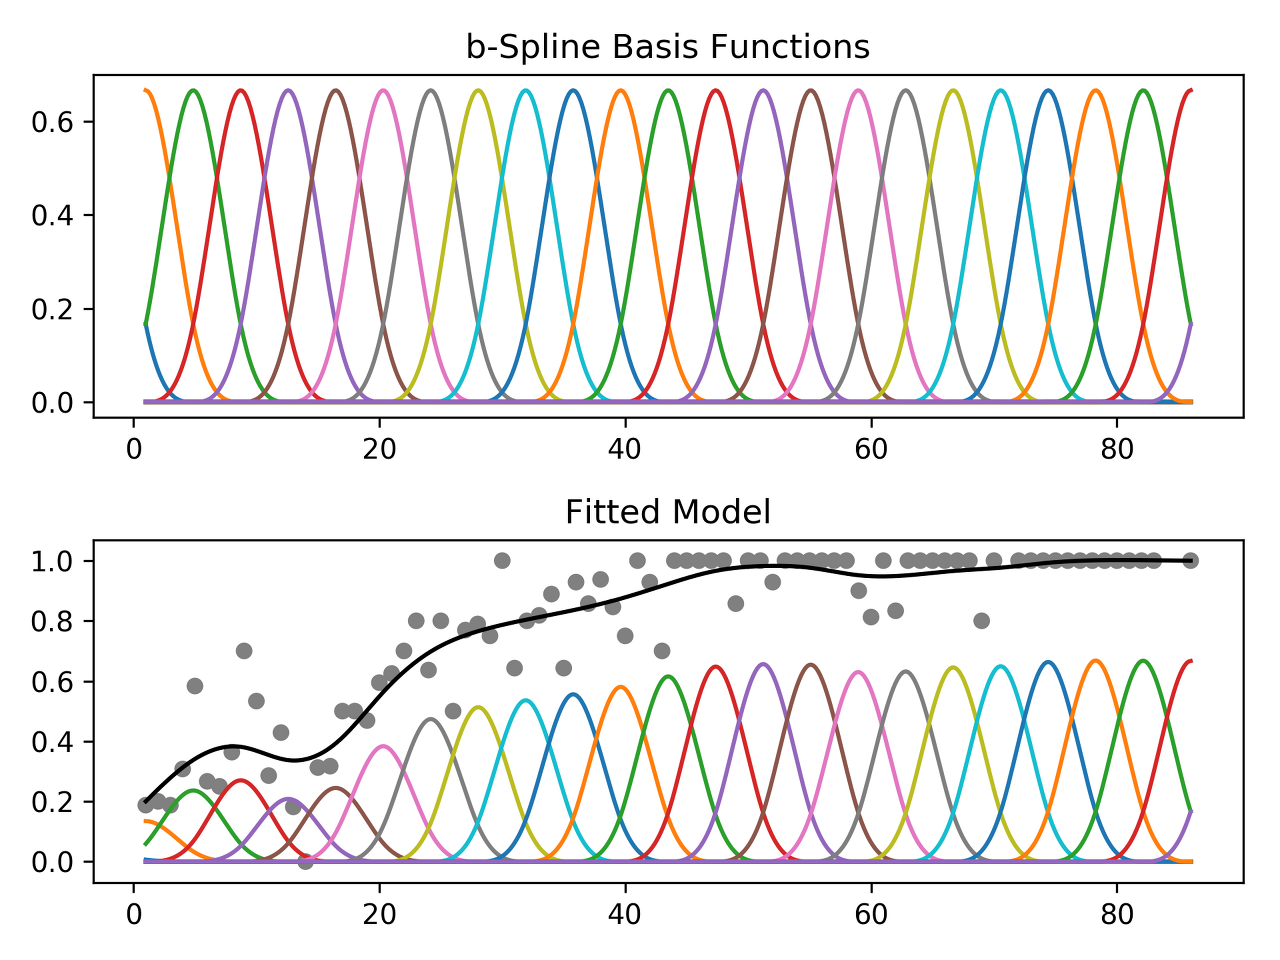
pyGAM
https://pygam.readthedocs.io/en/latest/index.html
https://www.youtube.com/watch?v=XQ1vk7wEI7c
#Reference
https://zzsza.github.io/development/2018/08/24/data-visualization-in-python/
Python에서 데이터 시각화하는 다양한 방법
Python에서 데이터 시각화할 때 사용하는 다양한 라이브러리를 정리한 글입니다 데이터 분석가들은 주로 Python(또는 R, SQL)을 가지고 데이터 분석을 합니다 R에는 ggplot이란 시각화에 좋은 라이브러리가 있는 반면 Python에는 어느 춘추전국시대처럼 다양한 라이브러리들이 있습니다 각 라이브러리들마다 특징이 있기 때문에, 자유롭게 사용하면 좋을 것 같습니다 Zeppelin도 시각화할 때 사용할 수 있지만, 라이브러리는 아니기...
zzsza.github.io
'LANGUAGE > Python' 카테고리의 다른 글
| How to solve the issue, 'cp949' codec can't decode? (0) | 2020.02.28 |
|---|---|
| Loop at exact time intervals (0) | 2019.09.11 |
| Python Tutorials (0) | 2019.08.23 |
| How to check whether a variable exists or not? (0) | 2019.08.01 |
| Screen Record via CV2 and MSS (0) | 2019.07.30 |